Dashboards in Kibana
In this post, i will try to help you understand how to analyze existing data located into elasticsearch to create usefull dashboards.
To feed some data into Elasticsearch, from the kibana home page, i will use the link “Try sample data“.
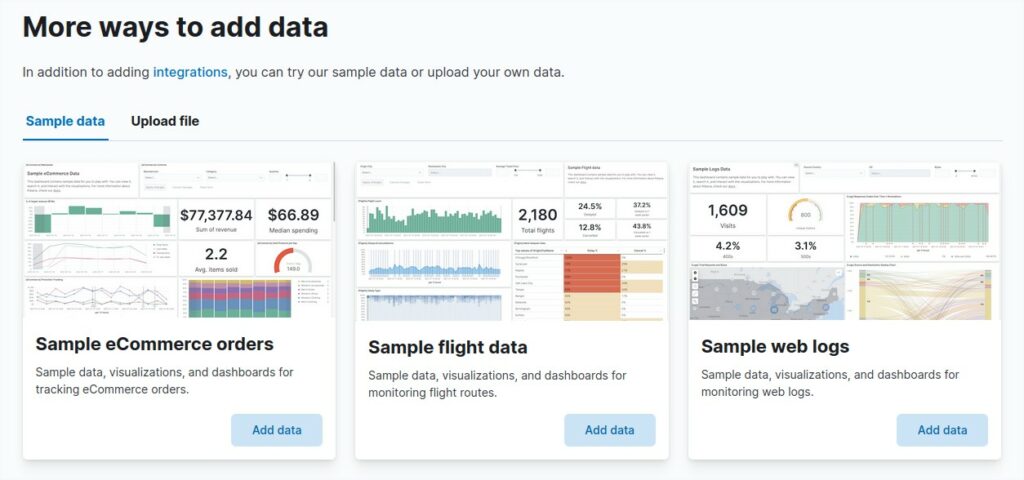
Next choose one of the three sample data. For this example, i choose “Sample web logs” by clicking on the button “Add data“.
After the data insertion. Clic on the top left menu and select the option Discover to view the data logs.
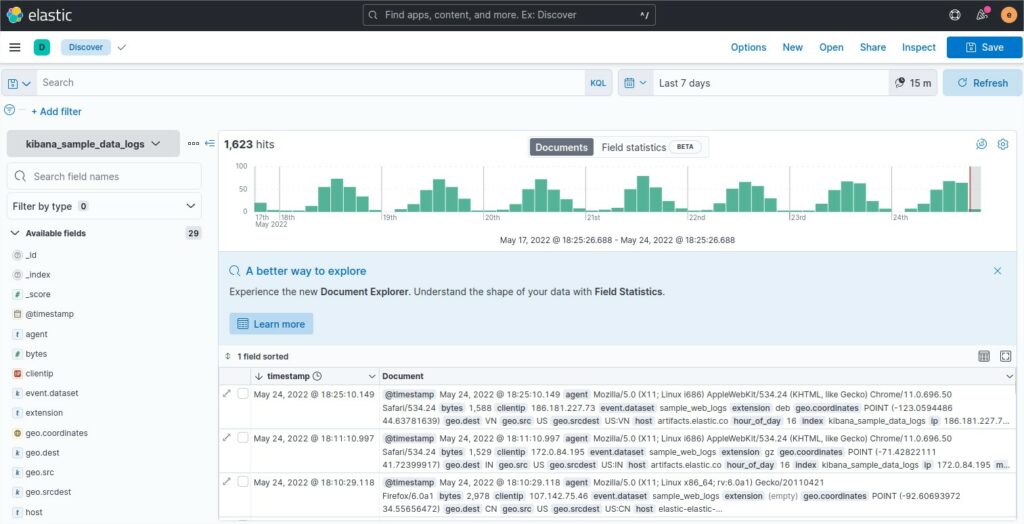
If you select one row, you will see this row as a table but also will have the choice to see it as a raw json.
From there you know which json element is present and can be used to create a usefull dashboard.
{
"_index": "kibana_sample_data_logs",
"_id": "_vzi9oAB8WFQcfknI5kN",
"_version": 1,
"_score": 1,
"_source": {
"agent": "Mozilla/5.0 (X11; Linux i686) AppleWebKit/534.24 (KHTML, like Gecko) Chrome/11.0.696.50 Safari/534.24",
"bytes": 1588,
"clientip": "186.181.227.73",
"extension": "deb",
"geo": {
"srcdest": "US:VN",
"src": "US",
"dest": "VN",
"coordinates": {
"lat": 44.63781639,
"lon": -123.0594486
}
},
"host": "artifacts.elastic.co",
"index": "kibana_sample_data_logs",
"ip": "186.181.227.73",
"machine": {
"ram": 20401094656,
"os": "ios"
},
"memory": null,
"message": "186.181.227.73 - - [2018-07-31T16:25:10.149Z] \"GET /apm-server/apm-server-6.3.2-amd64.deb HTTP/1.1\" 200 1588 \"-\" \"Mozilla/5.0 (X11; Linux i686) AppleWebKit/534.24 (KHTML, like Gecko) Chrome/11.0.696.50 Safari/534.24\"",
"phpmemory": null,
"referer": "http://www.elastic-elastic-elastic.com/success/dominic-a-antonelli",
"request": "/apm-server/apm-server-6.3.2-amd64.deb",
"response": 200,
"tags": [
"success",
"info"
],
"timestamp": "2022-05-24T16:25:10.149Z",
"url": "https://artifacts.elastic.co/downloads/apm-server/apm-server-6.3.2-amd64.deb",
"utc_time": "2022-05-24T16:25:10.149Z",
"event": {
"dataset": "sample_web_logs"
}
},
"fields": {
"referer": [
"http://www.elastic-elastic-elastic.com/success/dominic-a-antonelli"
],
"request": [
"/apm-server/apm-server-6.3.2-amd64.deb"
],
"agent": [
"Mozilla/5.0 (X11; Linux i686) AppleWebKit/534.24 (KHTML, like Gecko) Chrome/11.0.696.50 Safari/534.24"
],
"extension": [
"deb"
],
"tags.keyword": [
"success",
"info"
],
"geo.coordinates": [
{
"coordinates": [
-123.0594486,
44.63781639
],
"type": "Point"
}
],
"geo.dest": [
"VN"
],
"response.keyword": [
"200"
],
"machine.os": [
"ios"
],
"utc_time": [
"2022-05-24T16:25:10.149Z"
],
"agent.keyword": [
"Mozilla/5.0 (X11; Linux i686) AppleWebKit/534.24 (KHTML, like Gecko) Chrome/11.0.696.50 Safari/534.24"
],
"clientip": [
"186.181.227.73"
],
"host": [
"artifacts.elastic.co"
],
"machine.ram": [
20401094656
],
"extension.keyword": [
"deb"
],
"host.keyword": [
"artifacts.elastic.co"
],
"machine.os.keyword": [
"ios"
],
"hour_of_day": [
16
],
"timestamp": [
"2022-05-24T16:25:10.149Z"
],
"geo.srcdest": [
"US:VN"
],
"ip": [
"186.181.227.73"
],
"request.keyword": [
"/apm-server/apm-server-6.3.2-amd64.deb"
],
"index": [
"kibana_sample_data_logs"
],
"geo.src": [
"US"
],
"index.keyword": [
"kibana_sample_data_logs"
],
"message": [
"186.181.227.73 - - [2018-07-31T16:25:10.149Z] \"GET /apm-server/apm-server-6.3.2-amd64.deb HTTP/1.1\" 200 1588 \"-\" \"Mozilla/5.0 (X11; Linux i686) AppleWebKit/534.24 (KHTML, like Gecko) Chrome/11.0.696.50 Safari/534.24\""
],
"url": [
"https://artifacts.elastic.co/downloads/apm-server/apm-server-6.3.2-amd64.deb"
],
"url.keyword": [
"https://artifacts.elastic.co/downloads/apm-server/apm-server-6.3.2-amd64.deb"
],
"tags": [
"success",
"info"
],
"@timestamp": [
"2022-05-24T16:25:10.149Z"
],
"bytes": [
1588
],
"response": [
"200"
],
"message.keyword": [
"186.181.227.73 - - [2018-07-31T16:25:10.149Z] \"GET /apm-server/apm-server-6.3.2-amd64.deb HTTP/1.1\" 200 1588 \"-\" \"Mozilla/5.0 (X11; Linux i686) AppleWebKit/534.24 (KHTML, like Gecko) Chrome/11.0.696.50 Safari/534.24\""
],
"event.dataset": [
"sample_web_logs"
]
}
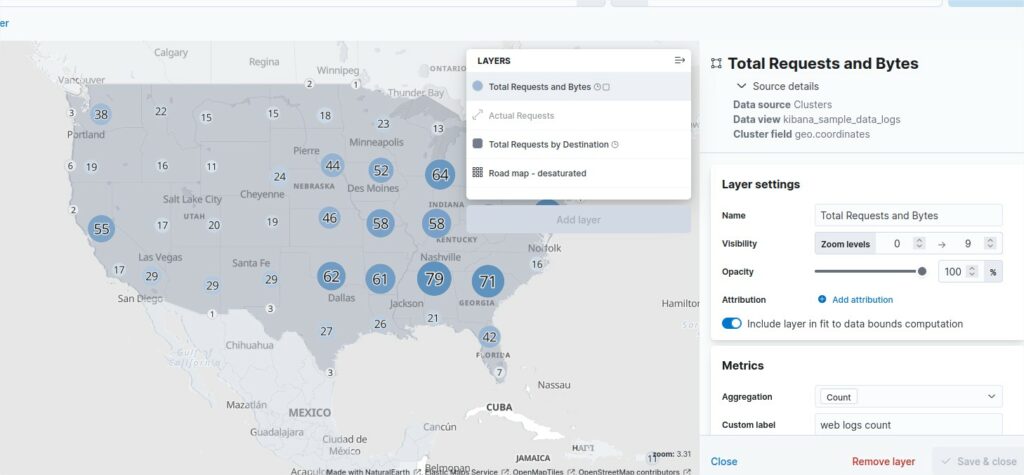
}If you check the dashboard of the sample called “[Logs] Total Requests and Bytes” and the data, there is a link between a the worldmap and this part of data
“agent”: “Mozilla/5.0 (X11; Linux i686) AppleWebKit/534.24 (KHTML, like Gecko) Chrome/11.0.696.50 Safari/534.24”,
“bytes”: 1588,
“clientip”: “186.181.227.73”,
“extension”: “deb”,
“geo”: { “srcdest”: “US:VN”, “src”: “US”, “dest”: “VN”, “coordinates”: { “lat”: 44.63781639, “lon”: -123.0594486 }
}
The fields bytes, client ip, agent and other fields regroup the requests to create the map.
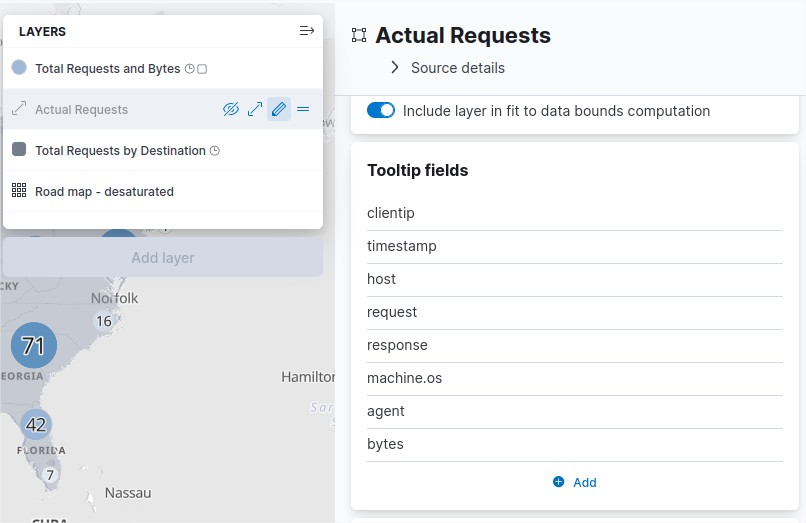
The field geo.coordinates are pointing the elements bytes, client ip, agent, and other fields based on lattitude and longiture fields.
Visualization types:
To create a visualization, kibana offers a wide list of options available:
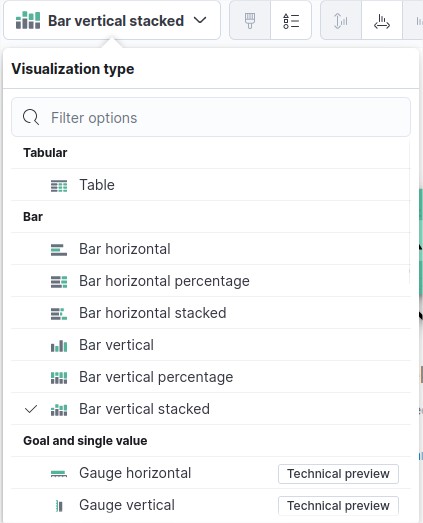
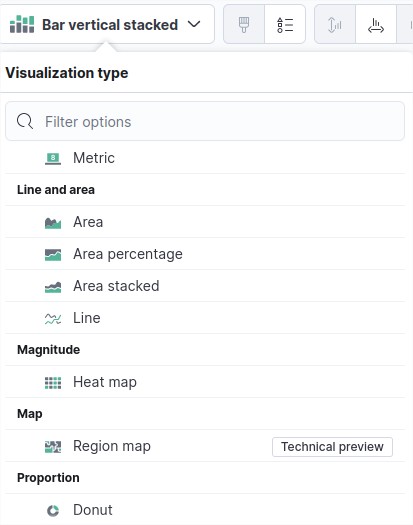
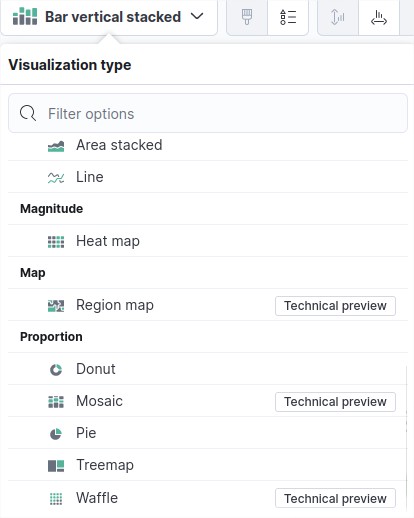
Histogram bars vertical and horizontal, Metrics, Lines and Areas, Donuts, Pies will count and regroup based on certain fields you may select.
Region map will display count data based on lattitude and longitude and regroup based on certain fields you may select..