Archives

MongoDB Cloud Atlas

In this post, i will show you how to work with MongoDB Cloud. The good point is that MongoDB offers a free version that you can test with a limitation of 512 mega bytes which is a good starting point.

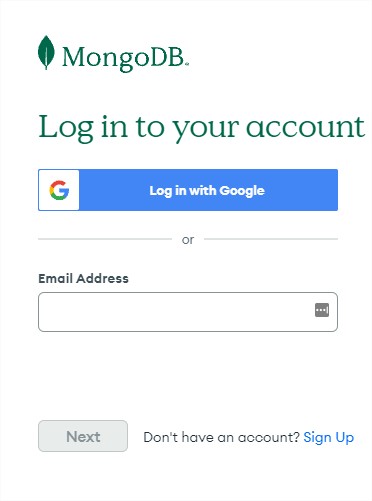
First go to https://cloud.mongodb.com/.

Log in with your google account or sign up.

You will be redirected to the home page

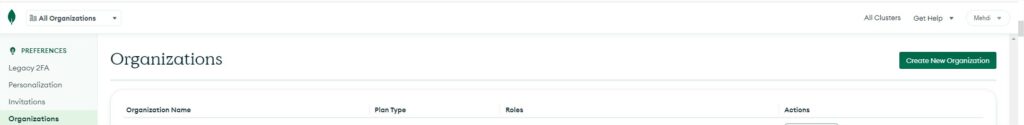
First of all we will create a New Organization

Organization can help to wrapp your projects and databases for instance in regions, departements or any idea you could have to separate your information. Click on the green button on the top left “Create New Organization”. Provide a name to your new organization.

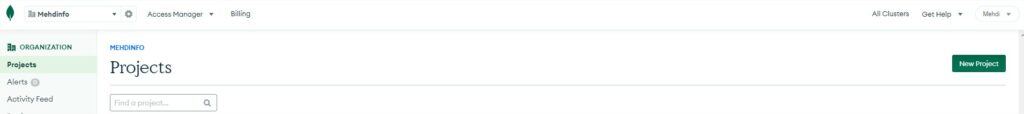
Select your new organization and create new Project. Click on the green button on the top left “New Project”. Provide a name to your new project.

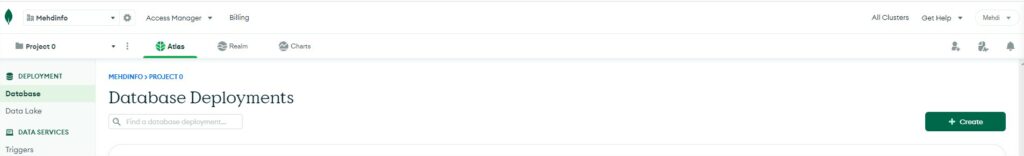
Select your new project and create a new Database. Click on the green button on the top left “+ Create”.

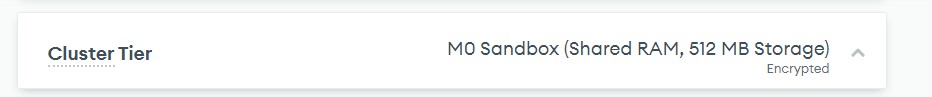
During the creation process, keep the cluster tier configuration to 512MB Storage and change de cluster name. The cluster will be composed of 3 loadbalanced mongodb servers.

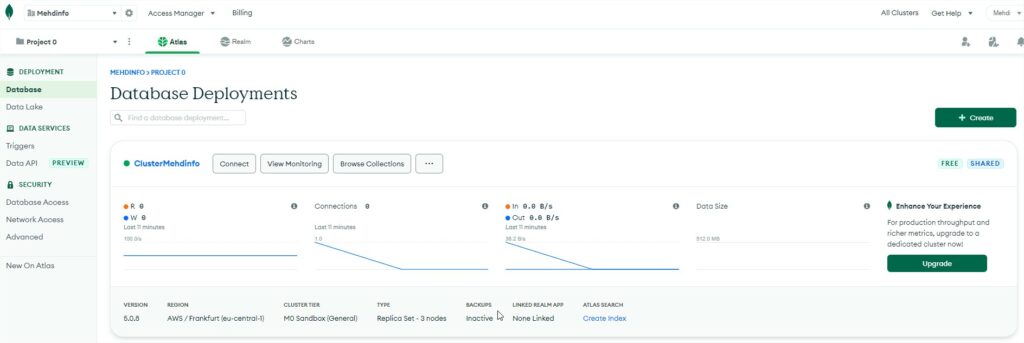
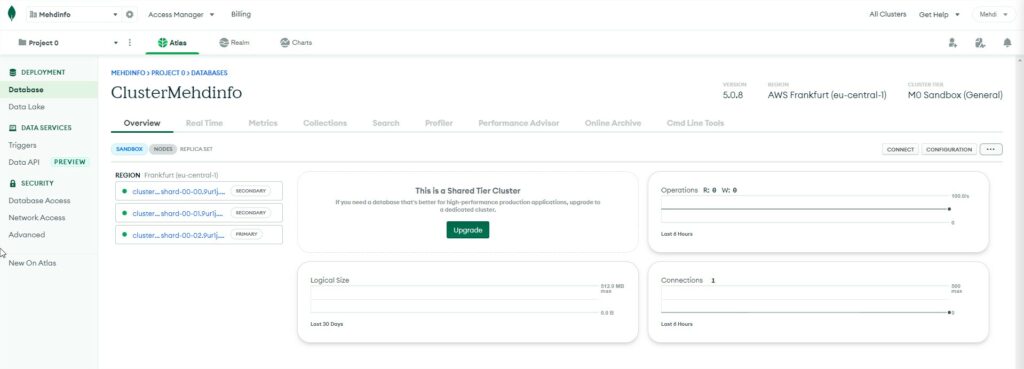
Wait until the cluster creation process is completed. You will end up with cluster up and running.

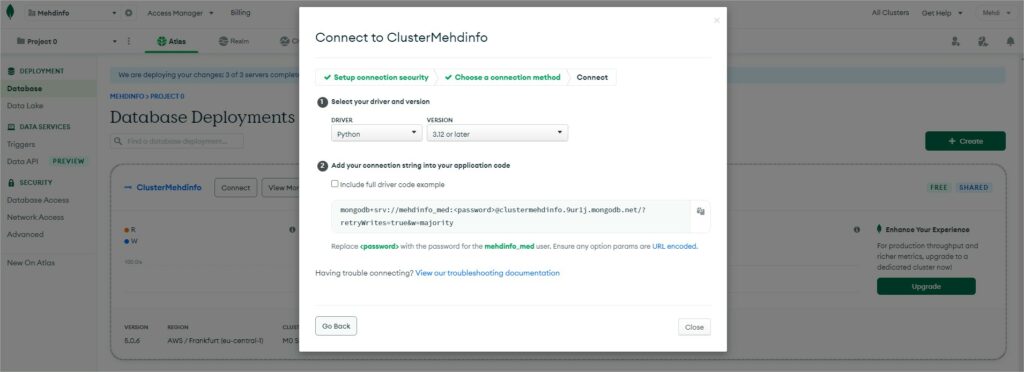
If you click on the button “Connect” and choose “Connect your application”, this will show some snippet code example for many different programming language such as Java, Python, GO, Perl, C, C++, C#, …

In my demo i will choose Python and a future post will be created with a git repo containing python code example to connect to mongodb, create a collection and apply CRUD operations to json documents.

Now if you select the cluster by clicking on it, you will arrive to the cluster overview page.

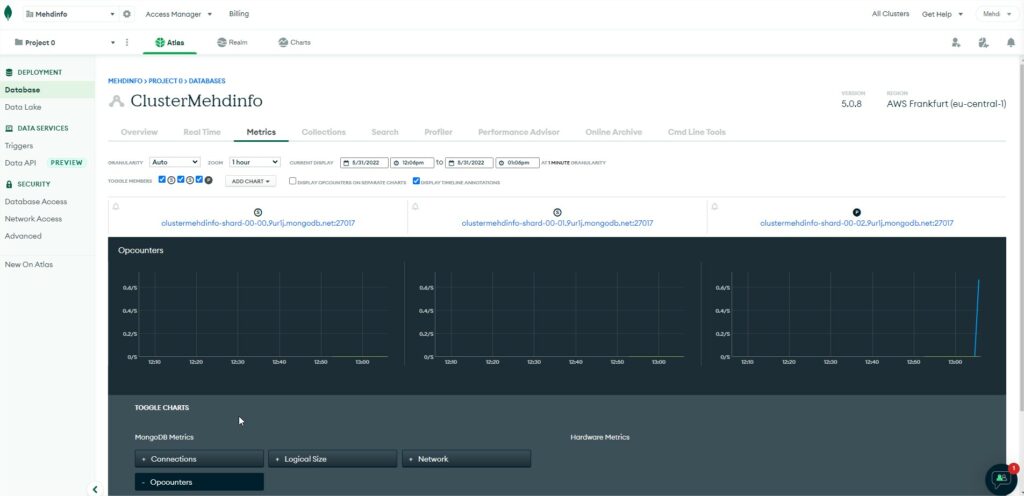
Select the “Metrics” tab and you will get an overview of the operation counters for the 3 servers.

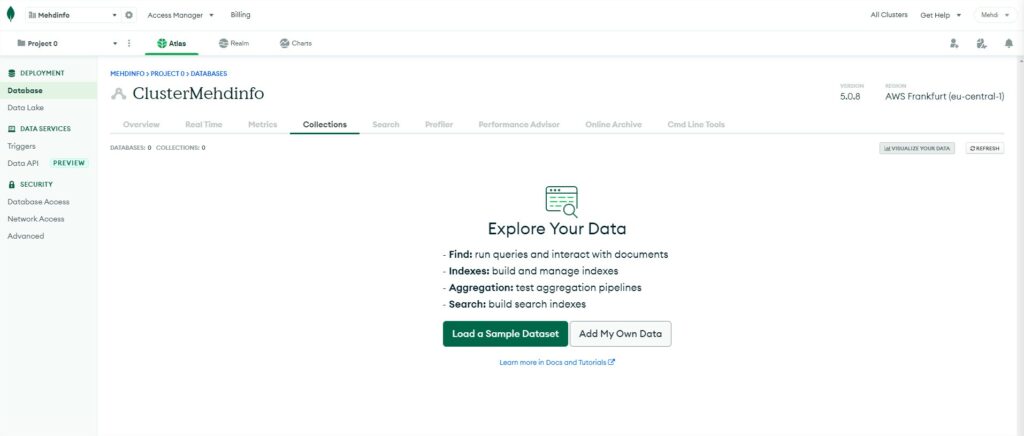
Select the “Collections” tab to browse data documents.

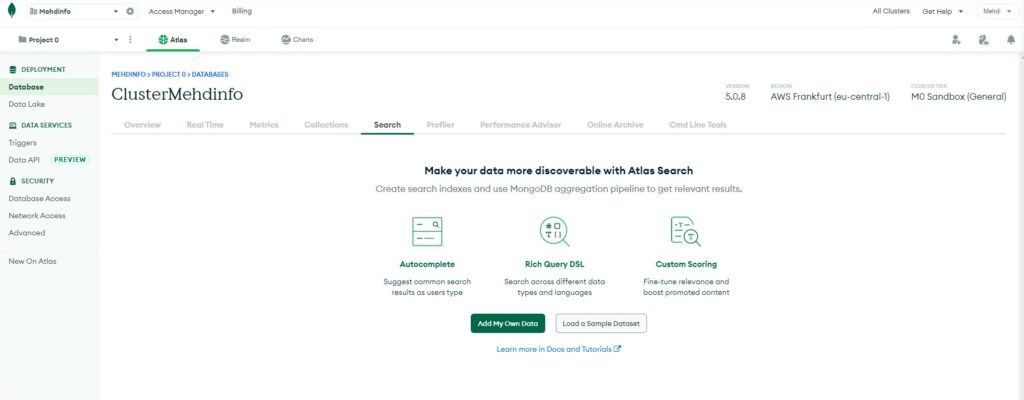
Select to “Search” tab to run DSL queries.

The “Profiler” tab, “Performance Advisor” tab, “Online archive” tab are only available with a paid plan so let’s skip those three options.

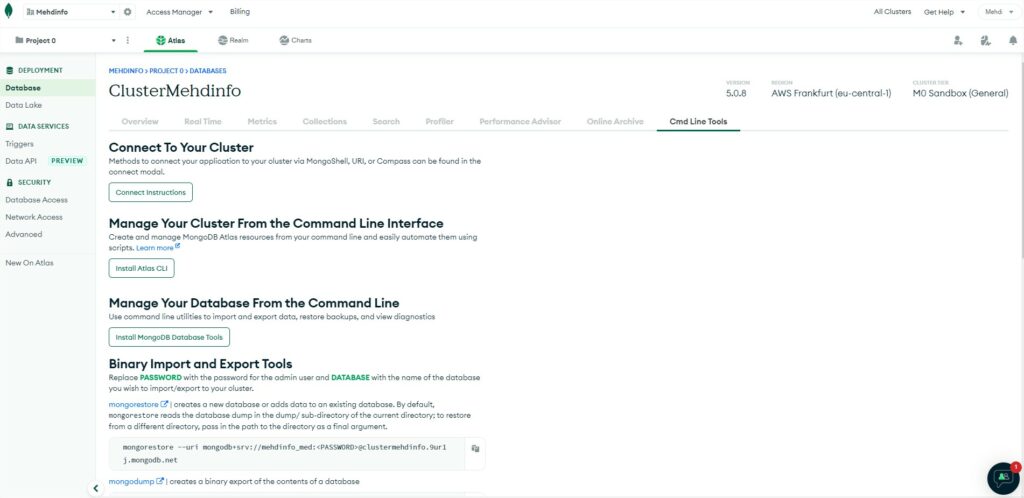
The last tab “Cmd line tools” will help you to see all the options to run command lines:

  • Connect instructions: will help you to connect from shell or programming language or with MongoDB Compass (GUI to browse and manage your Databases).
  • Atlas CLI: tool to install to manage DB by command line from brew for MacOS, yum or apt or tar.gz or deb or rpm for Linux or msi or zip for Windows.
  • MongoDB Database tools: is a suite of useful command lines to install on MacOs, Linux or Windows.
  • Mongorestore (binary exec file): is a tool to restore data comming from a dump (of Mongodump).
  • Mongodump (binary exec file): is a tool to create binary dump from a database.
  • Mongoimport (binary exec file): is a tool to import data from a csv, json, tsv file.
  • Mongoexport (binary exec file): is a tool to export data to a csv, json file.
  • Mongostat (binary exec file): is a tool to get metadata of a mongodb service.
  • Mongotop (binary exec file): is a tool providing time run for read write transaction of mongodb service.

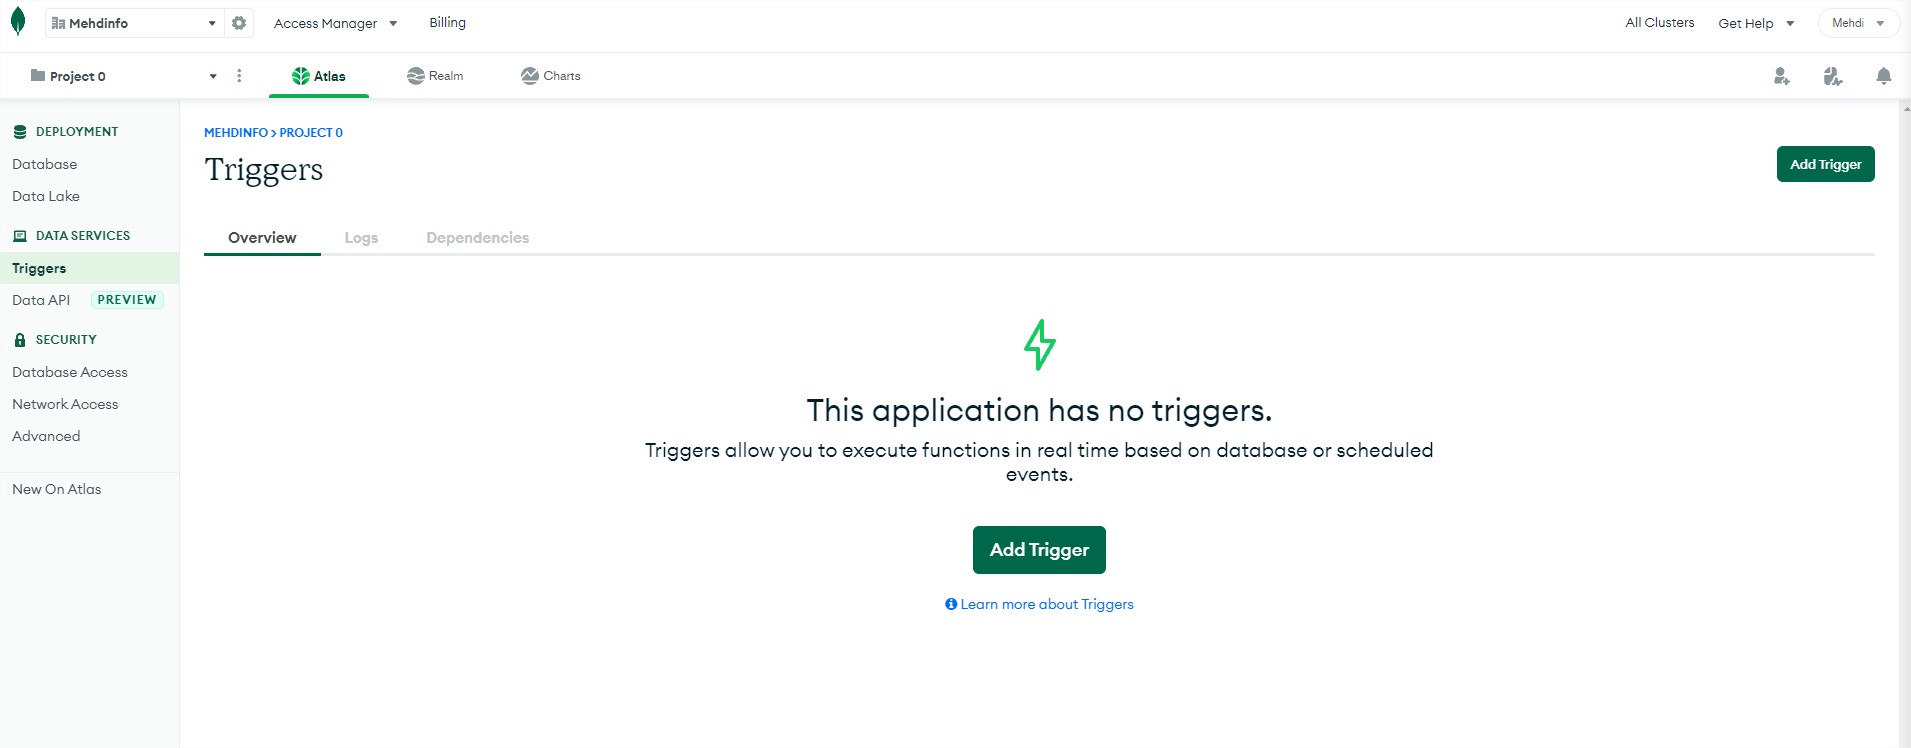
In the DATA SERVICES section, you will see two different options:

Triggers: allow you to run events based on crud operation that occured in a collection but you can also use the schedulded trigger to cron the code to execute.

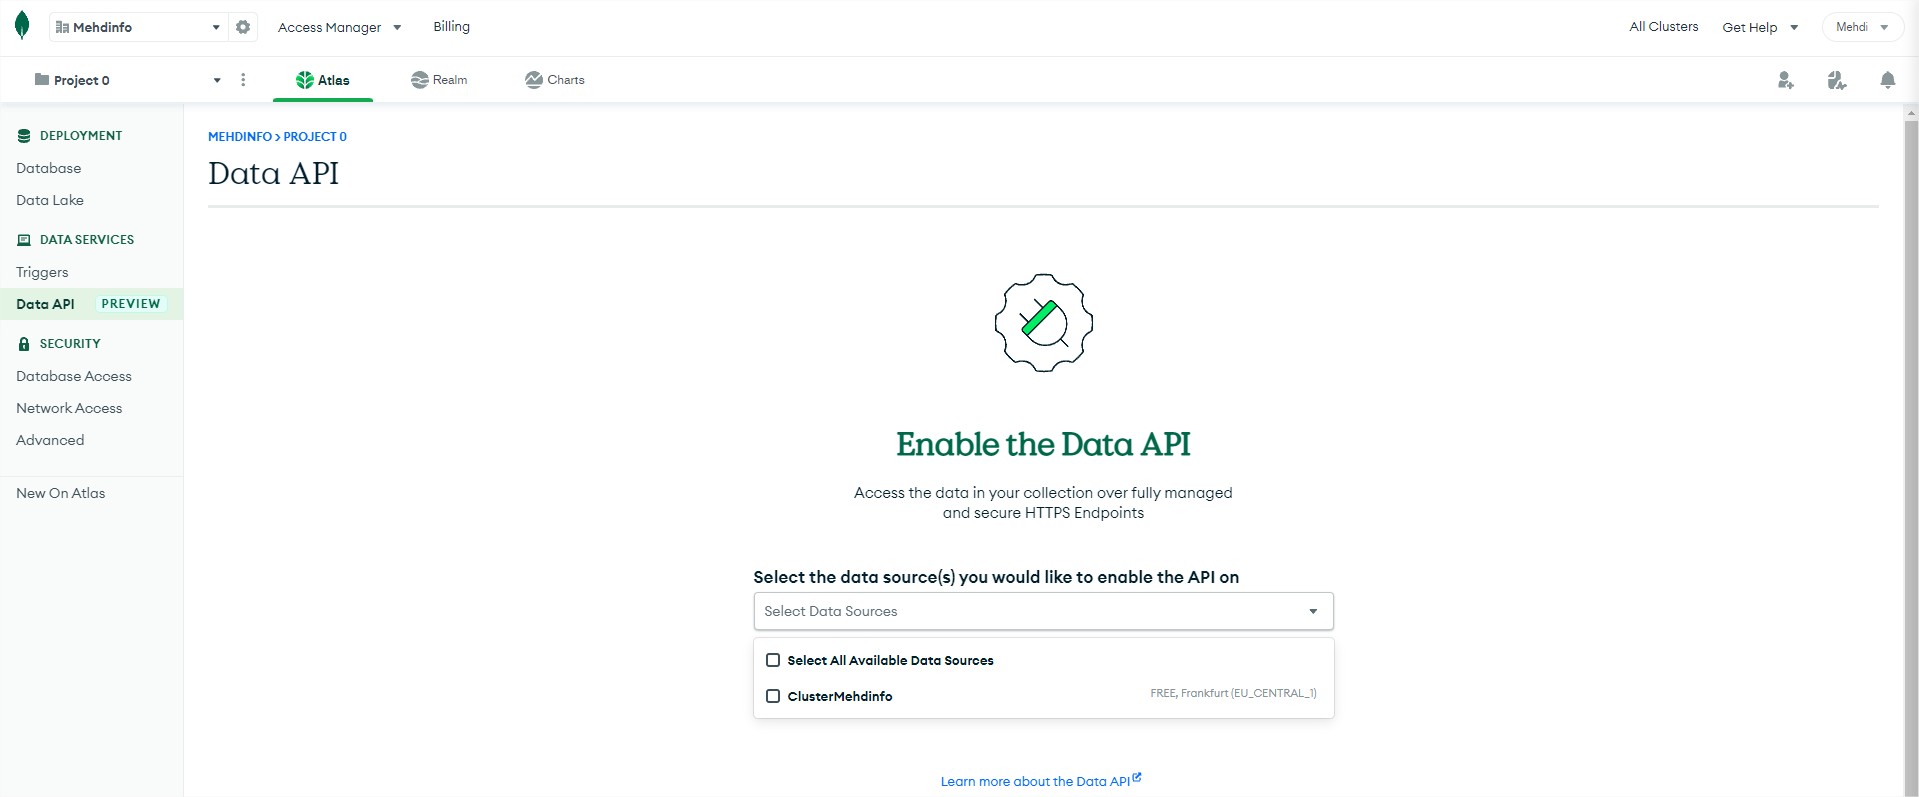
Data API: allow you to operate actions on one of multiple collections.

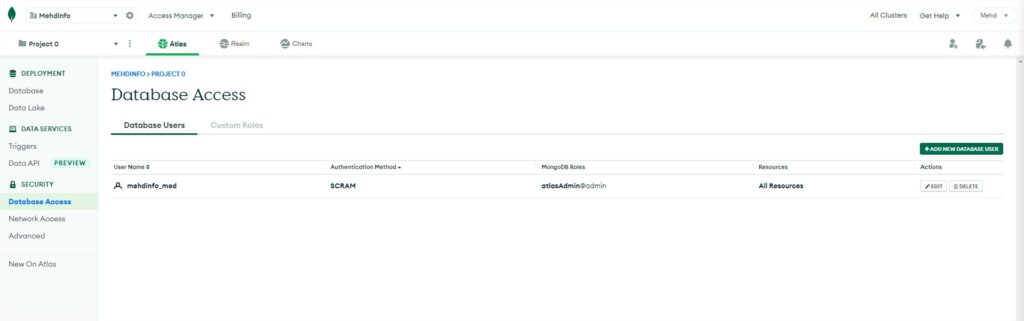
In the SECURITY section, you will see three different options:

Database access: this option is very important. This is where you will manage your IAM. You can create users with the option user/password access, of user/certificate access or link your Amazon WS IAM to manage your users. Each user can be configured with some basic roles attribution.

Network access: this option allows you to create an access list to filter the IP that will be allowed or denied to access the DB.

Advanced: this option allows you enable LDAP feature, data encryption and audit feature.

One last point i would like to mention is that if you would like to get a free to access any mongodb, i suggest you to download this free tool “MongoDB Compass”, you find it here ==> https://www.mongodb.com/products/compass

This concludes this small topic about Cloud Atlas.

The MQ Explorer

In this post i will help you understand what is the Eclipse Tool MQ explorer, how to use it and what are the options available.

When you download the MQ for Developers software, you can find the link here https://developer.ibm.com/articles/mq-downloads, it contains the MQ service and the MQ Explorer tool.

It allows to visualize the configuration of queue managers but also the data state and also metadata of each objects (such as queues, topics, subscriptions, …).

It is either usefull for developers to debug and configure their objects for their future development or useful for administrator to configure objects or export configurations.

After installing the MQ for Developers edition, start the MQ Explorer software.

When the tool is running, you will see in the top left corner eclipse view MQ Explorer – Navigator tab.

Lets begin by explaining each elements:

  • Queue Managers: This is one of the most import element. It allows to create a new local queue manager, transfert local queue manager to a distant server, connect to a remote queue manager but also run tests on all the local and remote queue managers configured.
  • Queue Manager Cluster: This element allowd to create a Queue manager cluster. This is will help to configure all the channel senders and receivers usefull to have an up and running cluster. The cluster configuration can be made by two different options:
    • Full repository: each QM member of the cluster will sync everything objects and data.
    • Partial repository: each QM member of the cluster will only sny objects. Data wont be synchronized.
    • The choice between the two options can have an impact on the network bandwith, The fact that only the objects must be the same but the queue managers will be separated in region for instance (Europe region will not have the same data than the Asian region but the softwares putting data will have the same behavior in Europe and in Asia).
  • JMS Administered Objects: This element is usefull to create a binding JNDI configuration file to share with developers. Each binding file will have the connection details to connect to a queue manager, a queue manager HA, a queue manager cluster and also destination queues/topics to send data. This allows to control and restrict the queues and topics availability.
  • Manage File Transfer: For those who have the feature MQ FT enabled on at least two different queue managers and that you configured your agents, this options allows to test, trace and configuration file transfer. It is also possible to cron file transfer from the MQ Explorer.
  • Service Definition Repositories: This option is less used than before. This allows to create a documentation that will become a WSDL to deploy to get description and documentation information. It can be compared to IBM WSRR.

Create a local queue manager with MQ Explorer

Create a local queue manager with MQSC

Ingest Pipelines

In this post i will explain what are ingest pipelines, what are their use case and how to create them.

https://www.elastic.co/guide/en/elasticsearch/reference/current/ingest.html

  • What is an ingest pipeline: it is a watcher analyzing data entering to an index and beforing being save can be transformed.
  • Possible actions: The transformation options available are: remove field, add field, enrich value of a field, convert field type.
  • The ingest pipeline option is located into the Stack Management section.
  • Use case:
    • If you have logstash between an agent or a software feeding data to elastic, you may use filter and/or grok system to do the same actions than an ingest pipeline.
    • But if you have agents or softwares feeding data directly to elastic and would like to manipulate data before being indexed you can use the ingest pipeline to do transformation.
      • It is also a good use case when you are now allowed to change the agent or the software that feed the data.
  • How to use it:
    • In the image above, you see the home page of the ingest pipeline menu.
      • Clic on the blue button “Create pipeline”. Choose “New pipeline“.
      • Give a relevant name to your new pipeline and a small description.
      • Clic on the button add processor. You can add many processor in the same pipeline.
      • In my example i convert the type of a field from integer to string.
      • I will use the json field response.
      • Next click on the button “Add”.
      • In front of the text “Test Pipeline:” Click on the link “Add documents”.
      • Insert a json sample you would like to test and run the test with the button “Run the pipeline”.
      • See the result if the transformation worked.
      • When your pipeline is complete, it is possible to save its configuration as an HTTP PUT request which will allow you to deploy it on other ELK environment or clusters.

Here is the json sample i used, see the field in red below:

{
  "_index": "kibana_sample_data_logs",
  "_id": "l_zi9oAB8WFQcfknI5oN",
  "_version": 1,
  "_score": 1,
  "_source": {
    "agent": "Mozilla/5.0 (X11; Linux i686) AppleWebKit/534.24 (KHTML, like Gecko) Chrome/11.0.696.50 Safari/534.24",
    "bytes": 4460,
    "clientip": "123.217.24.241",
    "extension": "",
    "geo": {
      "srcdest": "US:US",
      "src": "US",
      "dest": "US",
      "coordinates": {
        "lat": 42.71720944,
        "lon": -71.12343
      }
    },
    "host": "www.elastic.co",
    "index": "kibana_sample_data_logs",
    "ip": "123.217.24.241",
    "machine": {
      "ram": 11811160064,
      "os": "ios"
    },
    "memory": null,
    "message": "123.217.24.241 - - [2018-08-01T07:02:46.200Z] \"GET /enterprise HTTP/1.1\" 200 4460 \"-\" \"Mozilla/5.0 (X11; Linux i686) AppleWebKit/534.24 (KHTML, like Gecko) Chrome/11.0.696.50 Safari/534.24\"",
    "phpmemory": null,
    "referer": "http://nytimes.com/success/konstantin-kozeyev",
    "request": "/enterprise",
    "response": 200,
    "tags": [
      "success",
      "info"
    ],
    "timestamp": "2022-05-25T07:02:46.200Z",
    "url": "https://www.elastic.co/downloads/enterprise",
    "utc_time": "2022-05-25T07:02:46.200Z",
    "event": {
      "dataset": "sample_web_logs"
    }
  },
  "fields": {
    "referer": [
      "http://nytimes.com/success/konstantin-kozeyev"
    ],
    "request": [
      "/enterprise"
    ],
    "agent": [
      "Mozilla/5.0 (X11; Linux i686) AppleWebKit/534.24 (KHTML, like Gecko) Chrome/11.0.696.50 Safari/534.24"
    ],
    "extension": [
      ""
    ],
    "tags.keyword": [
      "success",
      "info"
    ],
    "geo.coordinates": [
      {
        "coordinates": [
          -71.12343,
          42.71720944
        ],
        "type": "Point"
      }
    ],
    "geo.dest": [
      "US"
    ],
    "response.keyword": [
      "200"
    ],
    "machine.os": [
      "ios"
    ],
    "utc_time": [
      "2022-05-25T07:02:46.200Z"
    ],
    "agent.keyword": [
      "Mozilla/5.0 (X11; Linux i686) AppleWebKit/534.24 (KHTML, like Gecko) Chrome/11.0.696.50 Safari/534.24"
    ],
    "clientip": [
      "123.217.24.241"
    ],
    "host": [
      "www.elastic.co"
    ],
    "machine.ram": [
      11811160064
    ],
    "extension.keyword": [
      ""
    ],
    "host.keyword": [
      "www.elastic.co"
    ],
    "machine.os.keyword": [
      "ios"
    ],
    "hour_of_day": [
      7
    ],
    "timestamp": [
      "2022-05-25T07:02:46.200Z"
    ],
    "geo.srcdest": [
      "US:US"
    ],
    "ip": [
      "123.217.24.241"
    ],
    "request.keyword": [
      "/enterprise"
    ],
    "index": [
      "kibana_sample_data_logs"
    ],
    "geo.src": [
      "US"
    ],
    "index.keyword": [
      "kibana_sample_data_logs"
    ],
    "message": [
      "123.217.24.241 - - [2018-08-01T07:02:46.200Z] \"GET /enterprise HTTP/1.1\" 200 4460 \"-\" \"Mozilla/5.0 (X11; Linux i686) AppleWebKit/534.24 (KHTML, like Gecko) Chrome/11.0.696.50 Safari/534.24\""
    ],
    "url": [
      "https://www.elastic.co/downloads/enterprise"
    ],
    "url.keyword": [
      "https://www.elastic.co/downloads/enterprise"
    ],
    "tags": [
      "success",
      "info"
    ],
    "@timestamp": [
      "2022-05-25T07:02:46.200Z"
    ],
    "bytes": [
      4460
    ],
    "response": [
      "200"
    ],
    "message.keyword": [
      "123.217.24.241 - - [2018-08-01T07:02:46.200Z] \"GET /enterprise HTTP/1.1\" 200 4460 \"-\" \"Mozilla/5.0 (X11; Linux i686) AppleWebKit/534.24 (KHTML, like Gecko) Chrome/11.0.696.50 Safari/534.24\""
    ],
    "event.dataset": [
      "sample_web_logs"
    ]
  }
}

And the json result, as you can see the field response in now as a string type, see the field in red below:

{
  "docs": [
    {
      "doc": {
        "_index": "kibana_sample_data_logs",
        "_id": "l_zi9oAB8WFQcfknI5oN",
        "_version": "1",
        "_source": {
          "referer": "http://nytimes.com/success/konstantin-kozeyev",
          "request": "/enterprise",
          "agent": "Mozilla/5.0 (X11; Linux i686) AppleWebKit/534.24 (KHTML, like Gecko) Chrome/11.0.696.50 Safari/534.24",
          "extension": "",
          "memory": null,
          "ip": "123.217.24.241",
          "index": "kibana_sample_data_logs",
          "message": "123.217.24.241 - - [2018-08-01T07:02:46.200Z] \"GET /enterprise HTTP/1.1\" 200 4460 \"-\" \"Mozilla/5.0 (X11; Linux i686) AppleWebKit/534.24 (KHTML, like Gecko) Chrome/11.0.696.50 Safari/534.24\"",
          "url": "https://www.elastic.co/downloads/enterprise",
          "tags": [
            "success",
            "info"
          ],
          "geo": {
            "coordinates": {
              "lon": -71.12343,
              "lat": 42.71720944
            },
            "srcdest": "US:US",
            "dest": "US",
            "src": "US"
          },
          "utc_time": "2022-05-25T07:02:46.200Z",
          "bytes": 4460,
          "machine": {
            "os": "ios",
            "ram": 11811160064
          },
          "response": "200",
          "clientip": "123.217.24.241",
          "host": "www.elastic.co",
          "event": {
            "dataset": "sample_web_logs"
          },
          "phpmemory": null,
          "timestamp": "2022-05-25T07:02:46.200Z"
        },
        "_ingest": {
          "timestamp": "2022-05-25T07:23:34.685600556Z"
        }
      }
    }
  ]
}

Alerting in Kibana

In this post i will explain how to manage alerts based on data stored into indexes.

This page will help you with many different demos to understand alertings: https://www.elastic.co/webinars/watcher-alerting-for-elasticsearch?blade=video&hulk=youtube

There are two ways to create alerts:

  • Either from the Kibana interface:
  • Or From the Dev Tool:
    • To create an alert from the dev tool, we are going to send to the Watch API of elastic an HTTP PUT operation
    • In this exampl the alert is configured with a cron, targets all the logstash indexes, search for the 404 reponse in the json body field during a certain time range, if the condition matches, an email is sent.
PUT _watcher/watch/my-watch
{
  "trigger" : {
    "schedule" : { "cron" : "0 0/1 * * * ?" }
  },
  "input" : {
    "search" : {
      "request" : {
        "indices" : [
          "logstash*"
        ],
        "body" : {
          "query" : {
            "bool" : {
              "must" : {
                "match": {
                   "response": 404
                }
              },
              "filter" : {
                "range": {
                  "@timestamp": {
                    "from": "{{ctx.trigger.scheduled_time}}||-5m",
                    "to": "{{ctx.trigger.triggered_time}}"
                  }
                }
              }
            }
          }
        }
      }
    }
  },
  "condition" : {
    "compare" : { "ctx.payload.hits.total" : { "gt" : 0 }}
  },
  "actions" : {
    "email_admin" : {
      "email" : {
        "to" : "admin@domain.host.com",
        "subject" : "404 recently encountered"
      }
    }
  }
}

Restrictions:

  • The alerting can really help to monitor message passing through the log, but there are some limitations.
  • To be able to use some connectors, the minimum subscription is to have the GOLD subscription.
  • With the free and basic subscription, the only connector available are Log server (Write your message alert into a log file), Index (Create an index with your message alert into it).
  • So without a GOLD subscription, i suggest to not focus a lot on alerting seen that the only connector types will need another monitoring system to be notified.

Dashboards in Kibana

In this post, i will try to help you understand how to analyze existing data located into elasticsearch to create usefull dashboards.

To feed some data into Elasticsearch, from the kibana home page, i will use the link “Try sample data“.

Next choose one of the three sample data. For this example, i choose “Sample web logs” by clicking on the button “Add data“.

After the data insertion. Clic on the top left menu and select the option Discover to view the data logs.

If you select one row, you will see this row as a table but also will have the choice to see it as a raw json.

From there you know which json element is present and can be used to create a usefull dashboard.

{
  "_index": "kibana_sample_data_logs",
  "_id": "_vzi9oAB8WFQcfknI5kN",
  "_version": 1,
  "_score": 1,
  "_source": {
    "agent": "Mozilla/5.0 (X11; Linux i686) AppleWebKit/534.24 (KHTML, like Gecko) Chrome/11.0.696.50 Safari/534.24",
    "bytes": 1588,
    "clientip": "186.181.227.73",
    "extension": "deb",
    "geo": {
      "srcdest": "US:VN",
      "src": "US",
      "dest": "VN",
      "coordinates": {
        "lat": 44.63781639,
        "lon": -123.0594486
      }
    },
    "host": "artifacts.elastic.co",
    "index": "kibana_sample_data_logs",
    "ip": "186.181.227.73",
    "machine": {
      "ram": 20401094656,
      "os": "ios"
    },
    "memory": null,
    "message": "186.181.227.73 - - [2018-07-31T16:25:10.149Z] \"GET /apm-server/apm-server-6.3.2-amd64.deb HTTP/1.1\" 200 1588 \"-\" \"Mozilla/5.0 (X11; Linux i686) AppleWebKit/534.24 (KHTML, like Gecko) Chrome/11.0.696.50 Safari/534.24\"",
    "phpmemory": null,
    "referer": "http://www.elastic-elastic-elastic.com/success/dominic-a-antonelli",
    "request": "/apm-server/apm-server-6.3.2-amd64.deb",
    "response": 200,
    "tags": [
      "success",
      "info"
    ],
    "timestamp": "2022-05-24T16:25:10.149Z",
    "url": "https://artifacts.elastic.co/downloads/apm-server/apm-server-6.3.2-amd64.deb",
    "utc_time": "2022-05-24T16:25:10.149Z",
    "event": {
      "dataset": "sample_web_logs"
    }
  },
  "fields": {
    "referer": [
      "http://www.elastic-elastic-elastic.com/success/dominic-a-antonelli"
    ],
    "request": [
      "/apm-server/apm-server-6.3.2-amd64.deb"
    ],
    "agent": [
      "Mozilla/5.0 (X11; Linux i686) AppleWebKit/534.24 (KHTML, like Gecko) Chrome/11.0.696.50 Safari/534.24"
    ],
    "extension": [
      "deb"
    ],
    "tags.keyword": [
      "success",
      "info"
    ],
    "geo.coordinates": [
      {
        "coordinates": [
          -123.0594486,
          44.63781639
        ],
        "type": "Point"
      }
    ],
    "geo.dest": [
      "VN"
    ],
    "response.keyword": [
      "200"
    ],
    "machine.os": [
      "ios"
    ],
    "utc_time": [
      "2022-05-24T16:25:10.149Z"
    ],
    "agent.keyword": [
      "Mozilla/5.0 (X11; Linux i686) AppleWebKit/534.24 (KHTML, like Gecko) Chrome/11.0.696.50 Safari/534.24"
    ],
    "clientip": [
      "186.181.227.73"
    ],
    "host": [
      "artifacts.elastic.co"
    ],
    "machine.ram": [
      20401094656
    ],
    "extension.keyword": [
      "deb"
    ],
    "host.keyword": [
      "artifacts.elastic.co"
    ],
    "machine.os.keyword": [
      "ios"
    ],
    "hour_of_day": [
      16
    ],
    "timestamp": [
      "2022-05-24T16:25:10.149Z"
    ],
    "geo.srcdest": [
      "US:VN"
    ],
    "ip": [
      "186.181.227.73"
    ],
    "request.keyword": [
      "/apm-server/apm-server-6.3.2-amd64.deb"
    ],
    "index": [
      "kibana_sample_data_logs"
    ],
    "geo.src": [
      "US"
    ],
    "index.keyword": [
      "kibana_sample_data_logs"
    ],
    "message": [
      "186.181.227.73 - - [2018-07-31T16:25:10.149Z] \"GET /apm-server/apm-server-6.3.2-amd64.deb HTTP/1.1\" 200 1588 \"-\" \"Mozilla/5.0 (X11; Linux i686) AppleWebKit/534.24 (KHTML, like Gecko) Chrome/11.0.696.50 Safari/534.24\""
    ],
    "url": [
      "https://artifacts.elastic.co/downloads/apm-server/apm-server-6.3.2-amd64.deb"
    ],
    "url.keyword": [
      "https://artifacts.elastic.co/downloads/apm-server/apm-server-6.3.2-amd64.deb"
    ],
    "tags": [
      "success",
      "info"
    ],
    "@timestamp": [
      "2022-05-24T16:25:10.149Z"
    ],
    "bytes": [
      1588
    ],
    "response": [
      "200"
    ],
    "message.keyword": [
      "186.181.227.73 - - [2018-07-31T16:25:10.149Z] \"GET /apm-server/apm-server-6.3.2-amd64.deb HTTP/1.1\" 200 1588 \"-\" \"Mozilla/5.0 (X11; Linux i686) AppleWebKit/534.24 (KHTML, like Gecko) Chrome/11.0.696.50 Safari/534.24\""
    ],
    "event.dataset": [
      "sample_web_logs"
    ]
  }
}

If you check the dashboard of the sample called “[Logs] Total Requests and Bytes” and the data, there is a link between a the worldmap and this part of data

“agent”: “Mozilla/5.0 (X11; Linux i686) AppleWebKit/534.24 (KHTML, like Gecko) Chrome/11.0.696.50 Safari/534.24”,

“bytes”: 1588,

“clientip”: “186.181.227.73”,

“extension”: “deb”,

“geo”: { “srcdest”: “US:VN”, “src”: “US”, “dest”: “VN”, “coordinates”: { “lat”: 44.63781639, “lon”: -123.0594486 }

}

The fields bytes, client ip, agent and other fields regroup the requests to create the map.

The field geo.coordinates are pointing the elements bytes, client ip, agent, and other fields based on lattitude and longiture fields.

Visualization types:

To create a visualization, kibana offers a wide list of options available:

Histogram bars vertical and horizontal, Metrics, Lines and Areas, Donuts, Pies will count and regroup based on certain fields you may select.

Region map will display count data based on lattitude and longitude and regroup based on certain fields you may select..

Logstash configuration

In this post, i will explain you the basics of logstash. This tool is a powerfull gateway that can apply transformation during the process of a message. It can listen to a port and wait for a message or connect to a service to extract the data as an ETL.

I will show you how to create a small logstash port listener and forward the data to elasticsearch.

First to download logstash please go to this page: Download logstash.

Either download the .deb file or rpm file for an easy and quick install or the compressed file for Windows, Linux or MacOS.

The folder contains at the root folder the binary file “logstash” or “logstash.exe” and a folder conf containing the “pipeline.yml” and “logstash.yml” configuration.

  • Create a logstash config file into the conf folder and name the file example.conf
  • With the configuration example, logstash will listen for the same service at the same on the HTTP port 5891 and on the beats protocol 5947 and will forward the data to Elastic on the url http://localhost:9200. Logstash will create every day an index with this name convention tomcat-local-yyyy-mm-dd
#Logstash configuration file
#Log messages can be received using http on port 5891
# or
#Log messages can be received using beats on port 5947
input {
   http {
      port => 5891
      codec => json
   }
   beats {
      port => 5947
      codec => json
   }
}
Data is sent to Elasticsearch to port 9200
output {
   elasticsearch { hosts => ["localhost:9200"]
      index => "tomcat-local-%{+yyyy-MM-dd}"
   }
}
  • Specify to logstash to take the config file example.conf in consideration
    • Add the config file into the pipeline.yml file
    • Give a unique pipeline id to this listener worker group
    • Point to the configuration file example.conf
    • Specify how many concurent thread will manage the data inputs that will be processed at the same time. (3 by default if pipeline.workers is not specified)
- pipeline.id: example
   path.config: "C:\logstash-8.1\conf\example.conf"
   pipeline.workers: 3

Start logstash and ensure that the the ports are listening and send a json example to see if logstash will forward it to elasticsearch.

Now i will show you how to connect to a msql DB and sends table rows to Elastic

  • The input section will use the mysql connector library, connect to mysql, run the SELECT statement every 5 minutes, the filter part will create field id, and remove 3 other fields before sending the data to elastic. The example also stores the latest value processed to be sure that the rows wont be processed twice.
input {
  jdbc {
  jdbc_driver_library => "C:\mysql-connector\mysql-connector-java-8.0.16.jar"
  jdbc_driver_class => "com.mysql.jdbc.Driver"
  jdbc_connection_string => "jdbc:mysql://127.0.0.1:3306/databaseexample"
  jdbc_user => USER_MYSQL
  jdbc_password => PASSWORD_MYSQL
  jdbc_paging_enabled => true
  use_column_value => true
  tracking_column_type => "numeric"
  schedule => "*/5 * * * * *"
 statement =>"SELECT * FROM example_table WHERE last_modified_time >:sql_last_value"
 use_column_value =>true 
  tracking_column =>last_modified_time 
  tracking_column_type => "timestamp"
  } 
}

 filter { mutate { copy => { "id" => "[@metadata][_id]"}
  remove_field => ["id", "@version", "unix_ts_in_secs"]
  }
}
output {
  elasticsearch {
   elasticsearch { hosts => ["localhost:9200"]
   index => "db-local-%{+yyyy-MM-dd}"
   document_id => "%{[@metadata][_id]}"
  }
}

Filebeat usage

In this post, i will explain how filebeat works and what are the possibilities to ingest logs and forward to Elastic/Logstash.

Filebeat is a small application that can be downloaded here : Dowload filebeat.

Either download the .deb file or rpm file for an easy and quick install or the compressed file for Windows, Linux or MacOS.

The application has on its root folder the binary file “filebeat” or “filebeat.exe” and the important configuration file “filbeat.yml“.

There are two ways to configure filebeat and two ways to forward data:

Configuration:

  • Configure by modules:
    • A Full list of modules can be enabled and are already compatible to parse logs from many different products.
    • Filebeat will parse and generate the json message with many different metadata (host, timestamp, log path, …)
    • To enable the module here is the command line: “filebeat modules enable MODULE_NAME
      1. Example: for IBM MQ : filebeat modules enable ibmmq
    • Here is a print screen with an exhaustive list of available modules.
  • Configure filebeat manually:
    • To be able to configure filebeat, you first need to understand how the log file you want to parse is structured.
    • Lets take an example:
[24/Feb/2015:14:06:41 +0530] "GET / HTTP/1.1" 200 11418
[24/Feb/2015:14:06:41 +0530] "GET /tomcat.css HTTP/1.1" 200 5926
[24/Feb/2015:14:06:41 +0530] "GET /favicon.ico HTTP/1.1" 200 21630
[24/Feb/2015:14:06:41 +0530] "GET /tomcat.png HTTP/1.1" 200 5103
[24/Feb/2015:14:06:41 +0530] "GET /bg-nav.png HTTP/1.1" 200 1401...
[24/Feb/2015:14:06:45 +0530] "GET /docs/ HTTP/1.1" 200 19367
[24/Feb/2015:14:06:45 +0530] "GET /docs/images/asf-logo.gif HTTP/1.1" 200 72790:
[24/Feb/2015:14:06:45 +0530] "GET /docs/images/tomcat.gif HTTP/1.1" 200 20660:
[24/Feb/2015:14:06:52 +0530] "GET /docs/logging.html HTTP/1.1" 200 38251
[24/Feb/2015:14:23:58 +0530] "GET /docs/config/valve.html HTTP/1.1" 200 111016
[24/Feb/2015:15:56:41 +0530] "GET /docs/index.html HTTP/1.1" 200 193670:
[24/Feb/2015:15:56:51 +0530] "GET / HTTP/1.1" 200 114180:
[24/Feb/2015:15:57:02 +0530] "GET /manager/html HTTP/1.1" 401 25380:
[24/Feb/2015:15:57:10 +0530] "GET /manager/html HTTP/1.1" 200 158290:
[24/Feb/2015:15:57:10 +0530] "GET /manager/images/tomcat.gif HTTP/1.1" 200 20660:
[24/Feb/2015:15:57:10 +0530] "GET /manager/images/asf-logo.gif HTTP/1.1" 200 7279
  • Log Analysis:
    • We can see it this log that it begins with [TIMESTAMP]
    • So the purpose will be to create a regex that will recognize the beginning of each line.
    • Here is the regex that will match each beginning of lines: [\d{2}\/[^0-9]{3}\/\d{4}:\d{2}:\d{2}:\d{2} +\d{4}]
  • Configure filebeat:
    • Enable the filebeat input section, point to the file path and add the regex into the filebeat.yml configuration file (!!! you can have multiple input streams meaning you can send data from multiple log or steam):

Now you see how to be able to ingest logs with the main options that filebeat offers.

Forward data:

  • To forward data, filebeat offfers two options (!!! you can have only ONE output stream meaning you can only have one destination):
    • Send to Logstash:
      • You send to logstash by http, https, beats, beats over TLS.
      • With authentication or anonymously.
    • Send to Elasticsearch:
      • You send to elastci by http, https.
      • With authentication or anonymously.

Here is a schema example to propose a point of view of filebeat usage: